 |
|
|
Homepage
Company profile
Consulting services
Software products
Media / Publications
Contact us
|
WinKFZ 7.1
WinKFZ is powerful software system for simulating the atmospheric dispersion of traffic-related emissions on inner-city streets and motorways, and helps assess the resulting traffic-induced immissions. Planning offices, private individuals offering consultanting services and government bodies concerned with environmental issues can use the application to simulate and assess existing or planned construction work and traffic measures.
Version history
WinKFZ 7.0 was initially released in mid-2004, implementing and massively extending the concepts of the earlier DOS application "KFZ". A series of updates including small extensions and bugfixes was released.
WinKFZ 7.1 includes a plethora of new, improved and extended functions and tools. It was released to the general public in October of 2005. An extensive list of changes is available.
Creating a scenario
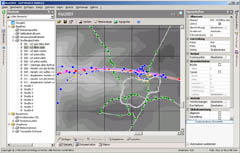
A WinKFZ scenario is initially created by defining the location and the size of the relevant area. The user can then proceed to add elements to the scene.
Elements are defined as objects that have a direct or indirect impact on the immission distribution in the defined field. There are six classes of elements:
Additional scene elements are:
To categorise elements and make project management more efficient, WinKFZ allows the user to group elements into layers, allowing the user to hide unneeded data or to highlight relevant elements.

Furthermore, WinKFZ allows the user to create and execute macros in the VBScript programming language, with an extensive and fully documented API for accessing the elements of a scenario.
This allows a high degree of project automatisation, e.g. switching between two sets of source data within the same project file, thus increasing user productivity.
Particle simulation
When the scenario input has been completed, the user can select a range of pollutants for the dispersion simulation. By choosing a year (2000-2020), the user can define which emission factor tables are used. Finally, the user chooses a simulation mode:
Prior to starting the simulation, the scenario undergoes extensive plausibility checks to ensure that the user has not entered questionable or conflicting data. Warnings and errors are displayed in a separate field in the main window to assist the user in quickly solving any potential problems.
Depending on the complexity of the scenario and the number of episodes and selected pollutants, the dispersion simulation can require up to several hours.
Simulation results
Once a simulation has been completed, the results are stored in a database and can be accessed and displayed until the results set or the entire scenario is deleted. The user has a variety of options when accessing the simulation results:
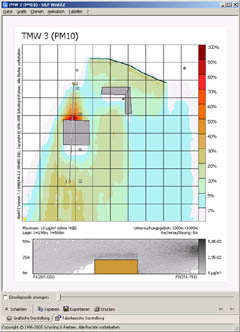
Having set up the plot, it is rendered and displayed in a separate window. Here, the user has many more options:
The separate images of a time series simulation (see above) can be exported and compressed into an animation file.
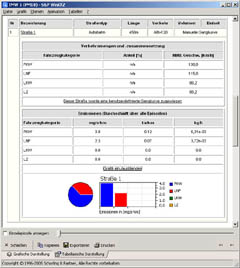
Additionally, a hierarchical set of tables and charts gives the user all the data he needs to incorporate information on the simulation in other documents, e.g. spreadsheets or reports.
A graphical tool for visualising the difference between two scenarios (e.g. "before/after implementing traffic measure") is provided.
All graphical and text-based results can easily be copied, printed and exported to a file.
Experience
This model has been deployed by Schorling & Partner to provide expert opinions assessing the effect of construction measures and/or traffic measures on traffic-induced immissions for numerous customers, including the German and Austrian governments, various German and Austrian cities, and the German armed forces.
Pricing and availability
Currently, the German-language version of WinKFZ is available for purchase. For further information or to request a demonstration of the product, please do not hesitate to contact us.
|
| Disclaimer | |
| Copyright © 1993-2009 Schorling & Partner, All rights reserved | |
